Level by Level
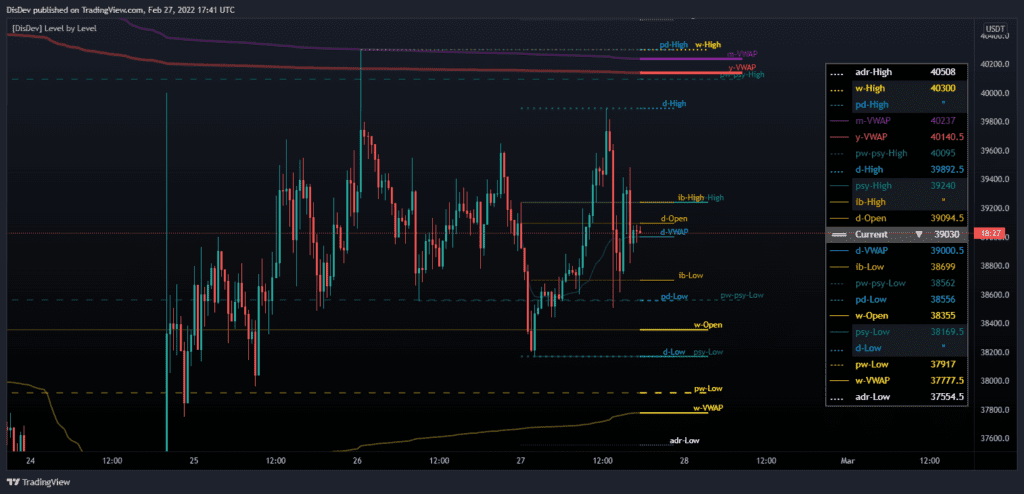
This indicator’s main objective is to provide you with the ability to choose the levels you are interested in with the added functions of the Level-by-Level Chart Reducer(™) and the Level-by-Level Table(™).
Technical Time Analysis
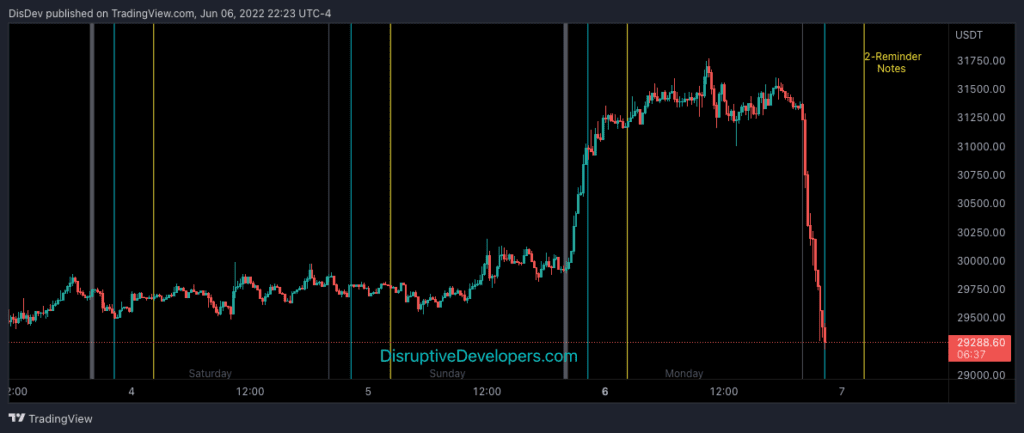
The basis of this indicator is to analyze past price movements and then project them as a reminder for traders that previously, at that particular time, there was a price increase/decrease.
Sessions, Initial Balance & Range Stats
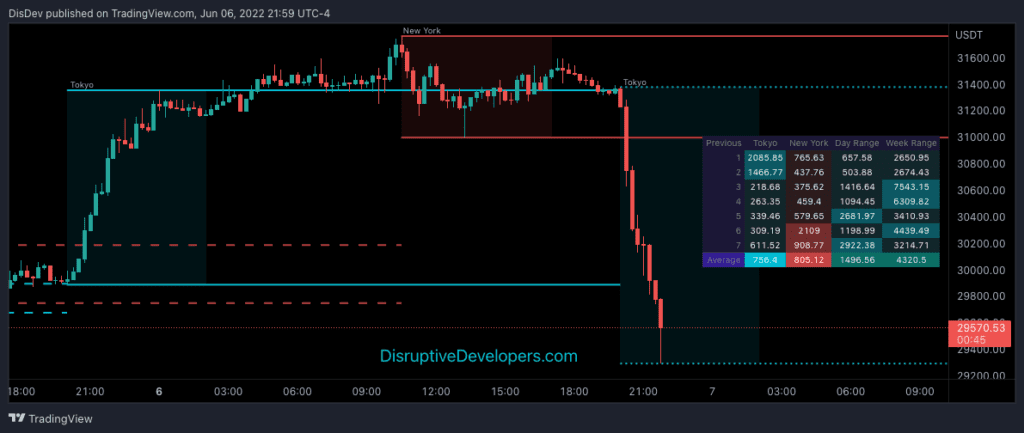
This indicator has two main components: Time-Specific Sessions and High/Low Statistics. There are also several subcomponents: Day of Week Separators, Specific Session High/Low Extenders, Day Range Statistics, Week Range Statistics, User Input Session Titles, etc.
High Volume Recovery
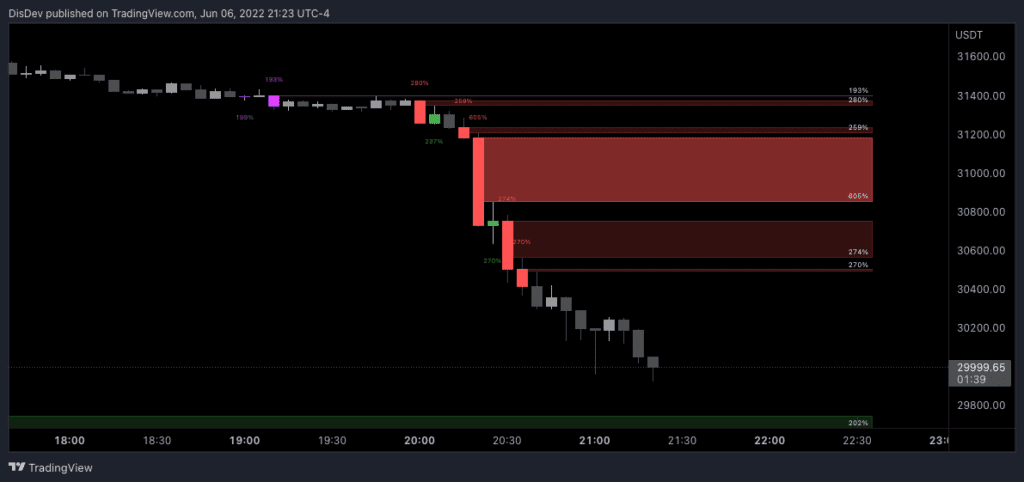
This indicator analyzes past volume movements, allowing you to visualize selected volume percentages above and below candles and to visualize live recovery of High-Volume Candles.
Stacey Burke’s 12 Candles
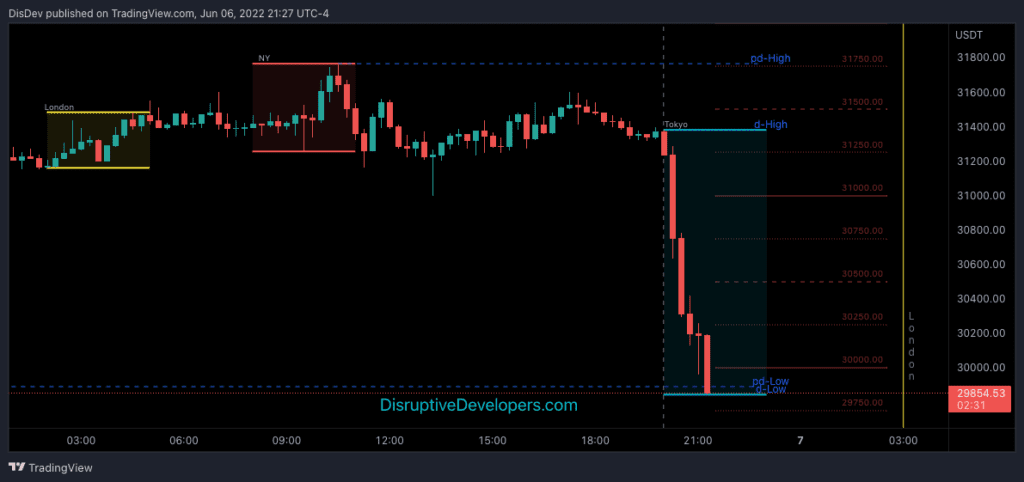
Inspired by Stacey Burke, this indicator highlights the essential 12 Candles of the three major Market Sessions. Future lines are drawn to show the user when the next session begins. It also provides the Highs and Lows of each Market Session, current day, and previous day. Additionally, it auto-calculates and displays Round Numbers of the 00, 25, 50, and 75 levels.
Disruptive Oscillators
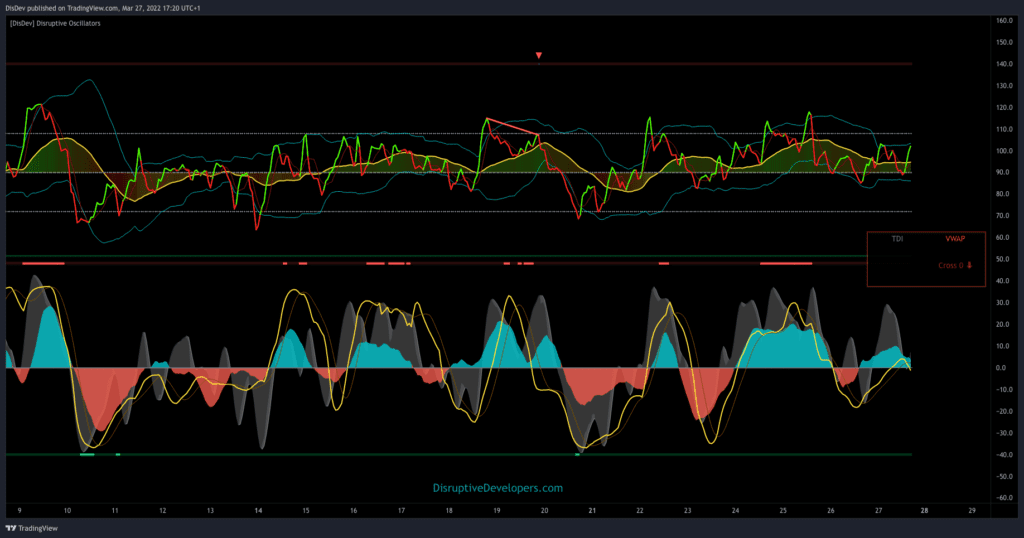
Disruptive Oscillators is a collection of five of the most popular trading oscillators: Trader Dynamic Indicator (TDI), Wave Trend Oscillator (WTO), Money Flow Index (MFI), and Volume Weighted Average Price (VWAP). We seamlessly blended all these into one indicator.