This indicator’s main objective is to provide you with the ability to choose the levels you are interested in, with the added functions of:
Level-by-Level Chart Reducer – This allows you to choose how many levels are above and below the current closing price to display.
Level-by-Level Table – This allows you to display all the levels within a table onto the chart.
The basis of this indicator is to provide you with a toolbox of levels that you can add to your trading plans.
Psychological Levels
A weekly range established each Saturday evening that can be thought of as a weekly “IB” or initial balance.
Average Daily Range (“ADR”) & Average Weekly Range (“AWR”)
In Forex, the International Monetary Fund (“IMF”) controls the allowable weekly swings of a currency’s price. The “AWR” and “ADR” perform calculations and dynamically adjust until the range is exceeded, at which time the levels will lock into place for the remainder of the day or week. The accepted theory is that price (even in Stocks and Crypto) will adhere to and remain within these levels, and, if exceeded, will revert back to them.
Initial Balance (“IB”)
In Crypto trading, it is generally accepted that the High and Low of the first hour of each day (00:00 – 01:00 UTC) is the Initial Balance. The IB generally thought of as a zone that sets the tone for the rest of the trading session. It is often a time of high volume and volatility , with Stop Hunts at the highs and lows of a range before price moves in one direction or the other. The IB is a Market Profile concept introduced by Peter Steidlmayer. There is plenty of information on the Internet to learn more about IB’s and how to implement them — please do your own research.
Daily Open
Since Crypto is traded 24 hours per day, the generally accepted open is 00:00 UTC, the Tokyo open. Please refer to Part 1 for more details on sessions, starting times, conversions, and Daylight Savings Time.
Volume Weighted Average Price (VWAP’s)
VWAPs are important areas on a chart. Institutional traders generally do not want to move price too far as they enter large buy or sell orders. So they wait for price to reach a tight zone around the VWAP where the majority of transactions occur on the Daily, Weekly, or Monthly timeframes. In these areas, there will be plenty of supply and demand for the institutional trader to execute their trades.
Weekly Open
The weekly open is Monday at 00:00 UTC.
Pivot Points ( Support & Resistance )
This indicator calculates pivot levels based on a tested formula that calculates past and subsequent bars or candles. It displays the two closest to price pivot levels. The pivot formula takes a window of left bars and right bars, and then finds the highest or lowest value in that window. The window marches across the bar-set to discover the pivots .
We coded the script to label the levels and colors dynamically, either Support (Green) or Resistance (Red), depending on whether they are above or below price. The primary level line stays with the same color scheme:
Blue = Daily / Yellow = Weekly / Violet = Monthly
As price crosses the level:
1 – The label will switch from Support to Resistance and Resistance to Support
2 – The extender line will switch from Green to Red and Red to Green
3 – The same changes will take place in the Level-by-Level Coordinates Table
A Note on Levels and Data
Understanding How Data is Calculated and Presented
Calculating levels requires going back in time through a symbol or asset’s historical data. Time is measured by bars (candles), so depending on the chart’s resolution (timeframe or TF) you are viewing, a different number of bars would be required to measure the same level.
For example, if we want to mark the Daily High and Low on the daily TF, we would be measuring 1 bar or candle. If we drop down to the 1-hour TF, we would need to measure 24 bars. For the 15-Minute TF it would be 96 bars (1hr/15min=4 bars per/hour and 4 x 24 = 96), and on the 1-Min TF, it requires 1,440 bars (1hr=60 Min and 6 x 24 = 1,440).
Hopefully, you get the idea and can see that the number of bars required increases exponentially as we move to weekly, monthly, and yearly levels.
TradingView Data
Please note this statement from TradingView’s website:
“The length of historical data for any intraday interval (i.e. chart timeframe) is 5,000 bars/candles (for Pro and Pro+ account holders it is doubled to 10,000 bars/candles and for Premium holders it’s quadrupled to 20,000) + additionally several bars/candles back to the beginning of the week, month or year (depending on the resolution). Unfortunately, this limit cannot be extended for now due to technical reasons. At lower resolutions (<30Min) Yearly and Monthly VWAPs may not show, but to overcome this issue the “Plot Save” function has been added to the settings to allow the user to manually input these levels. This concept is the same for Daily, Weekly, and Monthly pivots .
If you change the chart interval to daily or daily-based, you will see a longer date range. We display all available data for daily-based intervals.”
How we Handled Data Limitations
The Plot Level Feature in the Level by Level Indicator
We have written this script to always show levels at the lowest time frame allowable by TradingView.
If you do not see specific Support or Resistance levels, switch to a higher time frame, enter the corresponding values in the provided fields on the input panel, and check the Plot box. This will hard code the level in and will print on any TF. Additionally, we coded it so that when the Plot feature is enacted, the calculated level will be disabled so that there are no overlaps of two levels being printed.
Legend
The logic behind the line styles:
Solid = Static or established
Dashed = Static but previous week or day
Dotted = Dynamic or still developing — will turn solid once the values are locked in
*VWAPs would technically be a dotted line since they are fluid, however, TV does not handle the dots or dashes of a curved line well so we chose to keep this solid
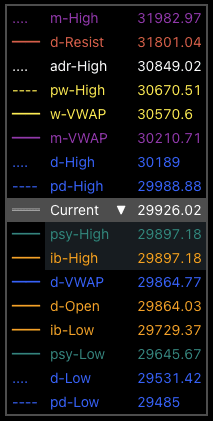
Level-by-Level Table
We designed this table to provide the user with a view of the levels in the correct price sequence on the chart at all times since, depending on the resolution and zoom levels, it would typically not be possible. The levels are equidistant and do not align with the actual price.
The current price will move vertically through the table according to the actual price and its relative position to the other various levels. The levels will change price and line styles dynamically as well.
The current price rectangle and the border can be in sync with High Volume Candle colors to draw more attention to the chart during climatic volume events.