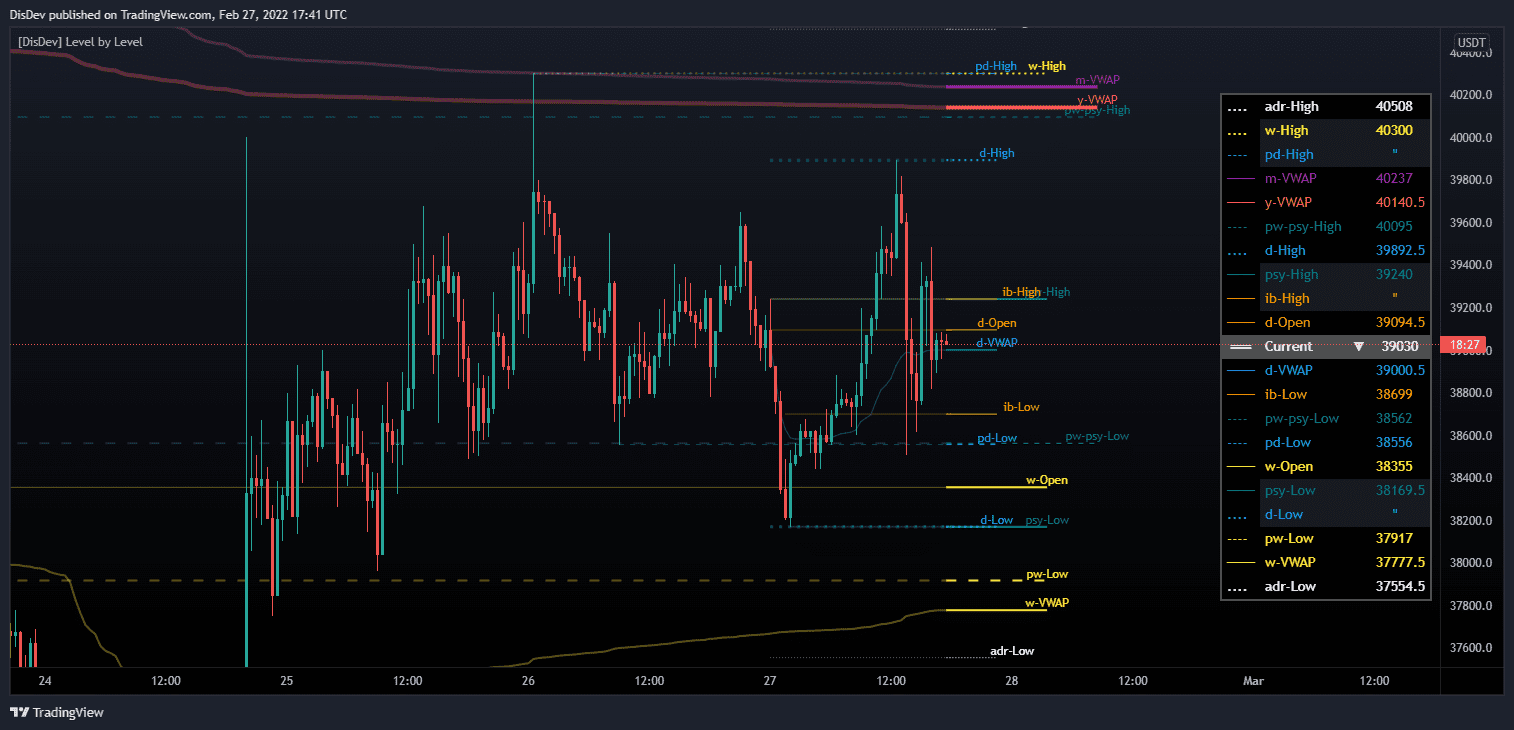
Level by Level
This indicator’s main objective is to provide you with the ability to choose the levels you are interested in with the added functions of the

Technical Time Analysis
The basis of this indicator is to analyze past price movements and then project them as a reminder for traders that previously, at that particular
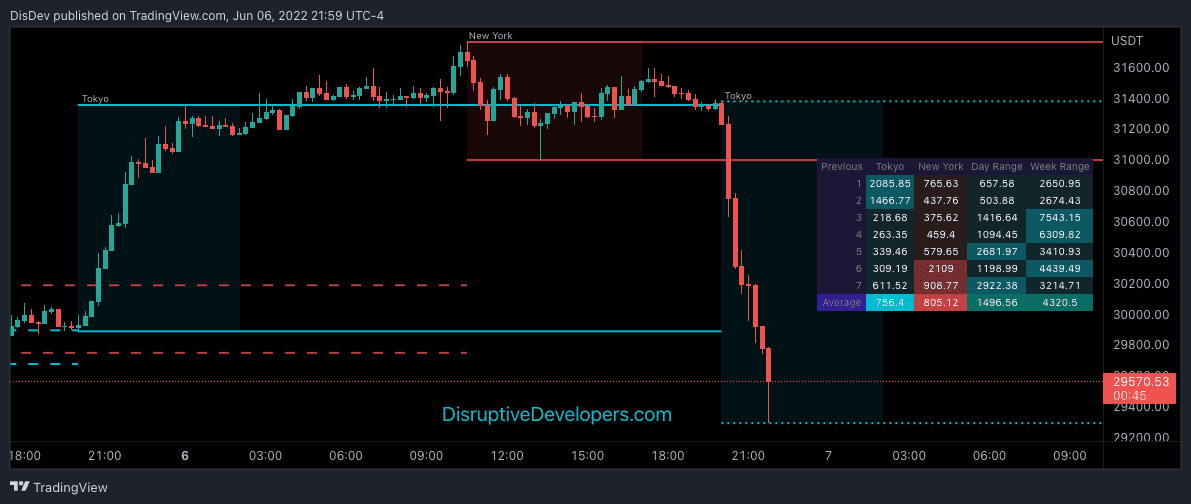
Sessions, Initial Balance & Range Stats
This indicator has two main components: Time-Specific Sessions and High/Low Statistics. There are also several subcomponents: Day of Week Separators, Specific Session High/Low Extenders, Day

High Volume Recovery
This indicator analyzes past volume movements, allowing you to visualize selected volume percentages above and below candles and to visualize live recovery of High-Volume Candles.
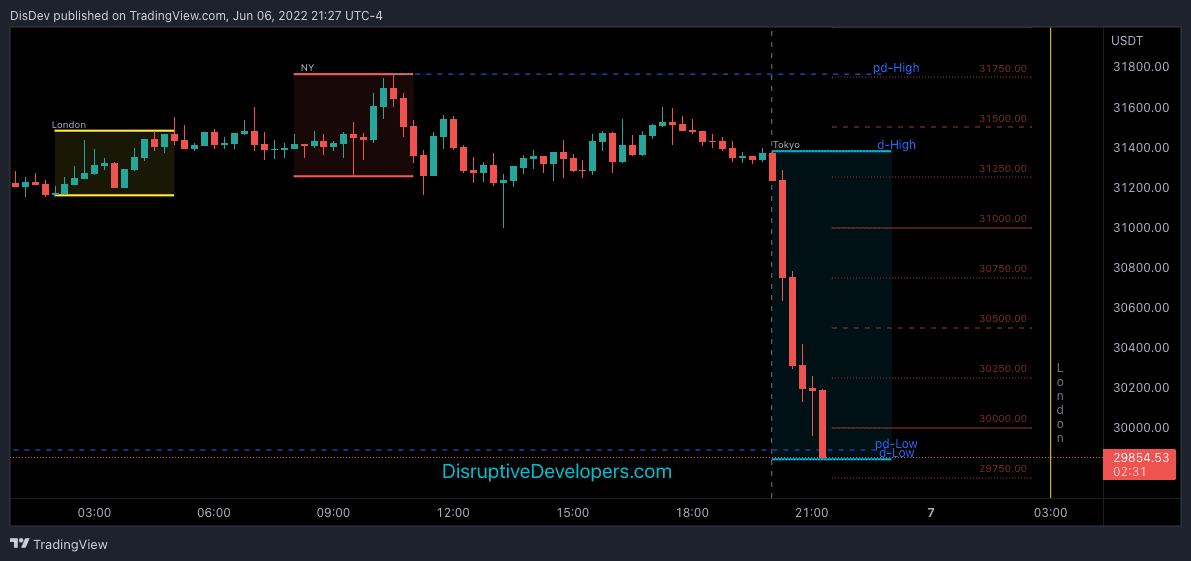
Stacey Burke’s 12 Candles
Inspired by Stacey Burke, this indicator highlights the essential 12 Candles of the three major Market Sessions. Future lines are drawn to show the user

Disruptive Oscillators
Disruptive Oscillators is a collection of five of the most popular trading oscillators: Trader Dynamic Indicator (TDI), Wave Trend Oscillator (WTO), Money Flow Index (MFI),